Столкнулся сегодня с задачей, в которой мне необходимо было высчитать производные в точке для дуги. Как и прежде я снова открыл справку и, так как я не обладаю высшим геометрическим образованием, я снова впал в ступор с вопросом «Какое же значение мне нужно?». Поэтому я решил сделать для себя и для всех небольшую шпаргалку-визуализацию.
Суть шпаргалки – получить визуальное представление для векторов класса Transform, получаемых при использовании метода Curve.ComputeDerivatives
В Revit API от класса Curve наследуется 6 классов, но я решил рассмотреть только два самых основных – Line и Arc. Причем, после получения результатов я понял, что Line можно было и не рассматривать (что на самом деле понятно и при прочтении справки).
Выдержка из справки:
The following is the meaning of the transformation members:
Origin is the point on the curve (equivalent to Evaluate(Double, Boolean) ).
BasisX is the tangent vector (the first derivative).
BasisY is the second derivative. Note that for curves where this cannot be uniquely determined (e.g. lines), this will be a Zero vector.
BasisZ is the bi-normal vector (tangent x normal). Note that for curves where normal cannot be uniquely determined (e.g. lines), this will be a Zero vector.
None of the vectors are normalized.
Обращаем внимание, что вектора не нормализованы!
Используя свою библиотеку для отрисовки геометрии в AutoCAD я написал следующий небольшой код:
using Autodesk.Revit.Attributes;
using Autodesk.Revit.DB;
using Autodesk.Revit.UI;

[Transaction(TransactionMode.Manual)]
[Regeneration(RegenerationOption.Manual)]
public class Class1 : IExternalCommand
{
    public Result Execute(ExternalCommandData commandData, ref string message, ElementSet elements)
    {
        RevitGeometryExporter.ExportGeometryToXml.FolderName = @"D:\Test\ComputeDerivatives";

        var line = Line.CreateBound(new XYZ(10, 0, 0), new XYZ(20, 0, 0));
        RevitGeometryExporter.ExportGeometryToXml.ExportCurve(line, "line");
        var derivatives = line.ComputeDerivatives(0.5, true);
        Export(derivatives, "line");

        var arc = Arc.Create(new XYZ(10, 10, 0), new XYZ(20, 10, 0), new XYZ(15, 12, 0));
        RevitGeometryExporter.ExportGeometryToXml.ExportCurve(arc, "arc");
        derivatives = arc.ComputeDerivatives(0.5, true);
        Export(derivatives, "arc");

        return Result.Succeeded;
    }

    private void Export(Transform derivatives, string curve)
    {
        if (!derivatives.BasisX.IsZeroLength())
        {
            RevitGeometryExporter.ExportGeometryToXml.ExportCurve(
                Line.CreateBound(
                    derivatives.Origin,
                    derivatives.Origin + (derivatives.BasisX.Normalize() * 3)),
                $"{curve} - tangent vector");
        }

        if (!derivatives.BasisY.IsZeroLength())
        {
            RevitGeometryExporter.ExportGeometryToXml.ExportCurve(
                Line.CreateBound(
                    derivatives.Origin,
                    derivatives.Origin + (derivatives.BasisY.Normalize() * 3)),
                $"{curve} - second derivative");
        }

        if (!derivatives.BasisZ.IsZeroLength())
        {
            RevitGeometryExporter.ExportGeometryToXml.ExportCurve(
                Line.CreateBound(
                    derivatives.Origin,
                    derivatives.Origin + (derivatives.BasisZ.Normalize() * 3)),
                $"{curve} - bi-normal vector");
        }
    }
}
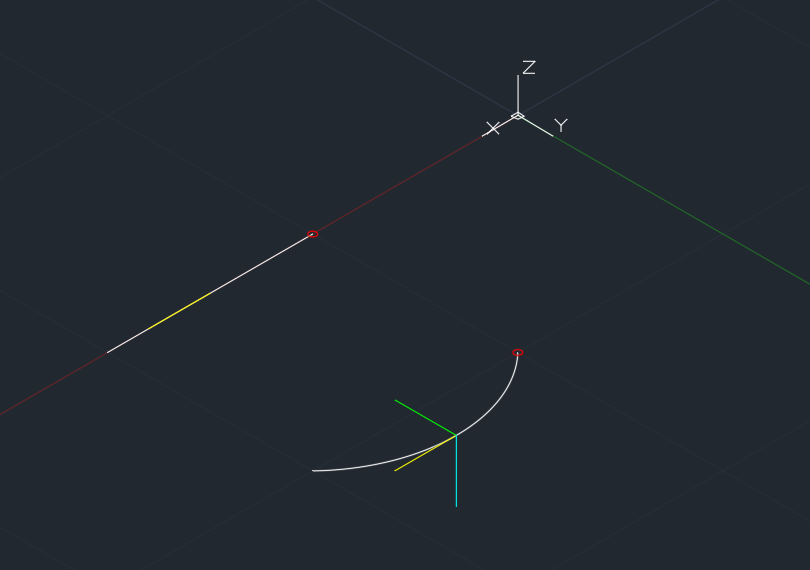
После отрисовки результатов в AutoCAD получил следующее:

где:
- Желтый отрезок – это Transform.BasisX – первая производная (касательный вектор)
- Зеленый отрезок – это Transform.BasisY – вторая производная
- Голубой вектор – это Transform.BasisZ – би-нормальный вектор
Все вектора имеют направление в сторону от точки на кривой. На скриншоте также отметил красными кружками начало кривых.


